Search for Proximons
The MetaProx database is a repository of proximon objects that can be searched according to their metagenomic source (e.g. soil, human digestive system, etc.), their functional characteristics (i.e. member genes containing specific functional annotations of interest), or a combination of both. Searching the database for proximons requires the MetaProx Search Tool which is a graphical user interface developed using Java. You can can either Download your own copy of the latest Search Tool (Recommended) or you can alternatively Launch a search directly from your browser. MetaProx has been developed to support a broad range of platforms and browsers. In particular, the Search Tool will attempt to use a standardized look and feel to provide a uniform user experience. However, certain browsers and/or outdated versions of Java might cause the interface to appear slightly different than its intended design. Therefore, we recommend installing the latest version of the Java Runtime Environment (JRE) to provide an optimal experience using the Search Tool.
The MetaProx Search Tool operates using a distributed resources paradigm that differs from many other searchable databases. Specifically, the search runs on your machine rather than making a search request to the server. The benefit of this approach is that you provide many of your own resources (e.g. memory and CPU) therefore allowing you to take advantage of your own hardware capabilities while simultaneously alleviating the limitations of server-imposed quotas. Moreover, MetaProx advocates a Data as Data (DaD) approach to the storage and transmission of information where all data are provided exclusively as serialized objects instead of markup-based representations.
Instructions on using the Search Tool can be found below or you can click here to Download or Launch the Search Tool. Also, please be aware that the Search Tool has been enabled to permit autonomous usage. Therefore, the Search Tool will stay visible and usable even after you have left the MetaProx website, until you no longer want to use it and manually close the interface. However, you must still be connected to the Internet in order for the Search Tool to run new queries.
Step 1 - Filter Proximons by Source
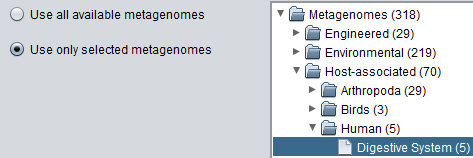
It is possible to search either the entire collection of proximon data or to select a smaller subset based on metagenome category. MetaProx uses the classification scheme implemented by the Integrated Microbial Genomes with Microbiome Samples (IMG/M) database to organize its data according to ecological features. Selecting the "Use only selected metagenomes" option will enable the metagenome tree allowing the selection of a particular ecological category or subcategory. Otherwise, the entire collection is selected by default. Also, it is possible to select multiple discontiguous categories by clicking more than one node on the metagenome tree while holding the CTRL (or equivalent) key. In the event of a broad query that is determined to be too time consuming, the search can be truncated at any time using the "Cancel" button (see Step 3) and all results obtained so far will be returned, rather than abandoning the entire search.
Step 2 - Filter Proximons by Target
Filtering Results by Proximon Properties
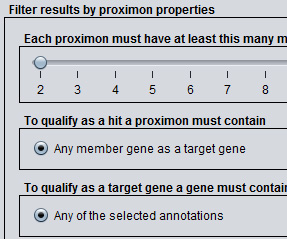
Query results can be filtered by changing the settings for any of the available proximon properties. Search results are returned sorted according to descending proximon length and there might be situations when it is desirable to exclude proximons that do not meet a minimum length requirement. This can be done by adjusting the minimum proximon length slider to increase the number of member genes (i.e. proximon length) required to qualify as a hit. Additional proximon constraints can be selected and specified in an AND versus OR context by using the various radio buttons. For example, it is assumed by default that only one member gene in a proximon is required to be a target gene (i.e. contain the qualifying annotations) in order for a proximon to qualify as a hit. It is possible to enforce the occurrence of qualifying annotations in every member gene of a proximon by selecting the "All member genes as target genes" option. Similarly, it possible to filter proximons to contain each functional annotation (see below) from a set of multiple annotations by selecting the "All of the selected annotations" option. By default, searching with multiple annotation constraints will return proximons that contain any of the selected annotations.
Filtering Results by Functional Annotations
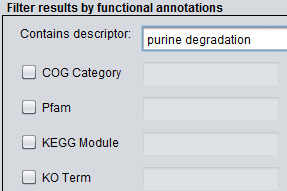
The most common search constraints involve filtering proximons by the presence of a keyword or a specific functional annotation value. To select by occurrence of a keyword or keyword fragment simply enter the search term in the "Contains descriptor" textbox. Alternatively, it is possible to specify a value from an existing annotation hierarchy, including COG Categories, COG Annotations, Pfams, TIGRFAMs, KEGG Modules, MetaCyc Pathways, KO Terms, and EC Annotations. For example, to filter proximons to include only those with the TIGRFAM annotation TIGR00083 (riboflavin biosynthesis protein RibF) select the TIGRFAM checkbox and enter the value 00083 in the corresponding textbox. Note, prefixes like TIGRFAM, Pfam, COG, etc. are omitted and only the actual annotation value itself is included.
Step 3 - Search and View Results
Running a Search
After you have selected your search criteria from the previous steps, you can launch your search with the Search command and you will see output about the progress of your search in the status window. A search can also be cancelled using the Cancel command. This will queue the search to break on the next metagenome and return all results obtained so far. Note, you can limit search time by using the Maximum search time slider.
Viewing the Results Summary
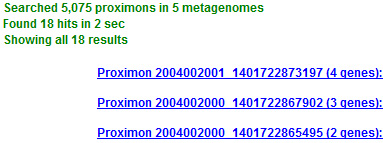
If a selected query generates any search results then the status window will display proximon data in the form of sorted links. Proximon links are ranked and sorted in descending order of length and each link displays the length of its corresponding proximon as well as some taxonomic information (hovering over a link will display all available taxonomic data). The status window will also report additional information including the total search time, the number of metagenomes searched, and the number of proximons searched within those metagenomes. The maximum number of search results that can be returned depends on the amount of available memory and the activity of the Java Virtual Machine. If there are more results than can be held in memory, the current collection of results becomes the maximum queue size. However, the search will continue and can replace members of the queue if higher ranking hits are found. The status window will display up to the top 100 search results for manual inspection. If there are more than 100 total results then the additional results are stored in memory and you can Save them for future use and downstream processing.
Viewing Proximon Details
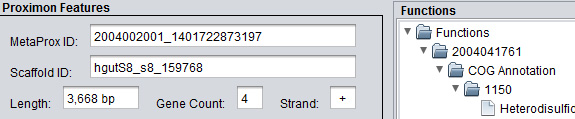
Clicking on a link inside of the status window will launch a separate Proximon Details panel for the corresponding proximon. The left-hand side of the panel contains the proximon properties. The upper left shows the Proximon Features including the MetaProx identifier, IMG/M source scaffold, the total proximon length (bp), the number of member genes, and the strand (+/-). The lower left shows the IMG/M Source Metagenome Properties including the sample name, the IMG/M identifier, and any available ecological taxa ranging hierarchically from ecosystem down to specific ecosystem. In addition, any available functional annotations are shown on the right-hand side of the panel in an expandable tree that is organized by member genes.
At the bottom of the panel is the Gene Map for the respective proximon. The Gene Map provides a graphical representation of the proximon with respect to its member genes. Each member gene is depicted sequentially according to its relative length and coordinates where the proximon begins at basepair 1. Right-clicking on the Gene Map allows the coordinates to be switched between relative and absolute values where the absolute values represent the gene coordinates on their original source scaffold. If a gene overlaps with a previous gene it will be displayed beneath that previous gene and all subsequent genes will be depicted at the same level until the next overlap where the overlapping gene will be displayed above the previous gene. Thus, toggling display heights are used to emphasize points of overlap with a proximon. If the underlying query involved Filtering Results by Functional Annotations then qualifying target genes will be appear as green and non-target genes will be uncoloured. Also, genes with no functional annotations will always appear as red, even if no filtering was selected. Any gene inside of the Gene Map can be clicked to produce detailed information (see below).
Viewing Gene Details
Clicking on a gene inside of the Gene Map of the Proximon Details panel will generate a Gene Details panel for the selected gene. The left-hand side of the panel displays the gene properties including the IMG/M gene identifier, the IMG/M source scaffold, the gene length (bp), the start coordinate (bp), the stop coordinate (bp), the strand (+/-), the gene product name (if available), the locus type, and the GC ratio. In addition, any available functional annotations are shown on the right-hand side of the panel in an expandable tree that is organized by annotation categories.
Saving Search Results
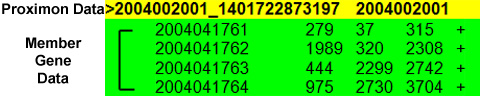
MetaProx search results can be saved to a variety of formats using the "Save" command followed by selecting a format from the dropdown box. By default, search results will be saved as serialized objects that can be reloaded later using the "Load" command. Results can also be saved as delimited text for parsing and further analyses where each individual proximon will be written to the output file using the following delimiters. Each new proximon begins on a new line and is demarcated from any preceding data by the ">" symbol. On the same line as the ">" symbol a series of proximon properties are written in tab delimited format. These include the MetaProx identifier, the IMG/M source metagenome identifier (see Step 1), the IMG/M source scaffold identifier, the total length of the proximon (bp), the number of member genes, the strand (+/-) in which the proximon occurs, and any available taxa describing the ecological category of the source metagenome. Next, member genes are delimited by line breaks and each line contains tab delimited properties about its respective gene. These include the IMG/M gene identifier, the gene length (bp), the coordinates (bp), the strand (+/-), the gene product name (if available), the locus type, the GC ratio, and any available functional annotations. Annotations occurring in the last field of the gene properties are written as single block due to the highly variable nature of their occurrences. However, the annotation block can be further parsed because it uses its own additional delimiters where each individual annotation is demarcated by the "~" symbol and the values within the annotation are delimited by the "$" symbol. For example, the MetaCyc Pathway PWY-2541 (plant sterol biosynthesis) would be written as ~MetaCyc Pathway$PWY-2541$plant sterol biosynthesis.
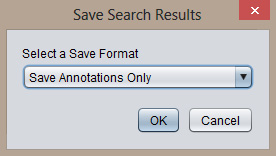
In addition, it is possible to save pairwise interactions for use with network analysis software by selecting "Save Annotations Only" from the format dropdown box followed by selecting an annotation category from the category dropdown box. This will create a formatted text file with respect to a specific annotative basis, such as COG categories or Pfam annotations. Specifically, a two-column tab delimited file is constructed where each proximon contributes a set of pairwise interactions that depend on the length of the proximon and number of annotations belonging to the selected type. For example, consider a proximon of length 3 where the member genes have the following COG category annotations: { gene1([M]), gene2([G]), gene3([R]) } Saving the COG categories from this proximon would yield the following adjacent interactions; [M] - [G] and [G] - [R], as well as the transitive interaction [M] - [R]. Pairwise interactions are not delimited by source proximon under the assumption that the collective set of interactions represents an aggregate network of interest.
